

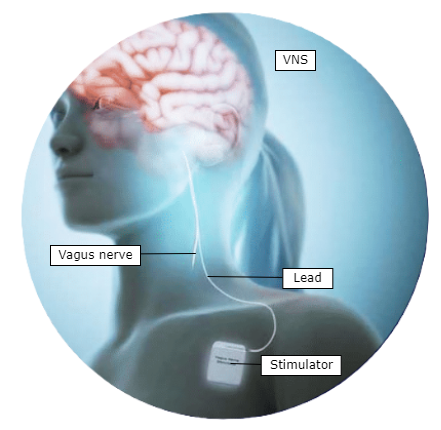
Vagus nerve stimulation (VNS) is a promising innovation in the treatment of chronic conditions already treating a large population in epilepsy, depression, obesity, cardiac arrhythmia, and more. In its current clinical applications, patients receive a static dose of electrical stimulation to the nerve which must be individually adjusted by a clinician during clinic visits. Preliminary studies suggest that patient-responsive closed-loop therapies, where a stimulation device automatically adjusts stimulation patterns for a real-time and personalised intervention, have the potential to significantly improve outcomes.
Developing a closed-loop neuromodulation system is challenging because of the large amounts of data transferred between the brain and the organs, which needs to be decoded and used in closed-loop to infer optimal stimulation strategies. When recording from a nerve, an important hurdle is identifying from which type of nerve fibre a signal is originating; this informs which organ or physiological mechanism is impacted.
In the present work, we use machine learning to automatically identify which nerve fibres have been recruited in the vagus nerve following electrical stimulation. The protocol we present here marks a proof of concept toward a pipeline where large data acquisition could inform real-time vagus nerve stimulation therapies. As part of this protocol, we propose an annotation tool to visualise and annotate the segmented responses to create a richer dataset.
Background on eCAP Segmentation
VNS: VNS is a therapeutic technique that leverages the delivery of electrical impulses to the vagus nerve. This process typically involves the surgical implantation of a small device, similar to a pacemaker, which is connected to the vagus nerve. By modulating the activity of the vagus nerve, clinicians can influence neural pathways involved in mood regulation, seizure control, inflammation modulation, autonomic function, among other physiological functions.
eCAPs: The fibres in a nerve activate as action potentials (like neurons in the brain). The sum of these action potentials from distinct axons is called a compound action potential (CAP). Thus, the neural response following VNS is characterised by evoked CAPs (eCAPs), which are at the core of VNS efficacy.
In neuromodulation therapy, to produce the intended effect upon stimulation, different eCAPs must be elicited such that activation of different fibre types can be controlled to examine the effects on physiology; see Berthon (2023) [1].
Automated eCAP segmentation involves partitioning the neural response obtained from neural recordings as a time-series into distinct segments, each corresponding to specific fibre types activated by the stimulus. In machine learning, this problem can be formulated as a 1D time-series segmentation problem. We design our models such that the influential experiment parameters like current intensity (mA), stimulation pulse width (μs), and stimulation polarity (anodic/cathodic) can be fed in.
Dataset
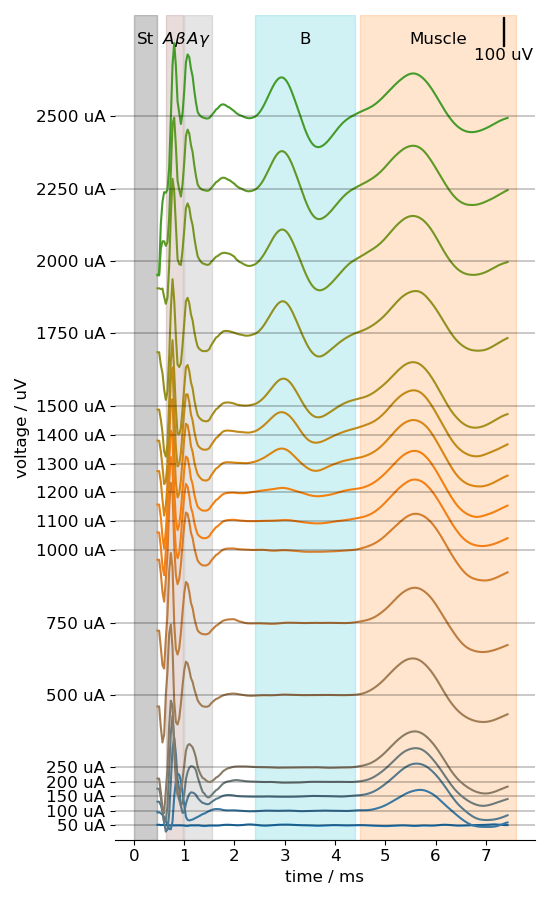
Every neurogram sample is a time-series of 290 data points representing nerve activation in μV in an animal model. The manually labelled bounds marking the start and end of different fibre activations were converted to a continuous label mask. Every data point corresponds to an integer label denoting the fibre type it belongs to. Points not belonging to one of the four fibre types of interest were encoded to a generic label “other”. The dataset contains 129,768 samples.
The data used in the current experiments was labelled manually by experts who observed the activation trends of various fibres using a stacked plot similar to Figure 2.
Methods
Baseline
The simple baseline averages the manually labelled start and end limits of the bounds for every fibre type across training subjects. All the test samples were assigned the same bounds for each fibre type. This establishes a reasonable data-based baseline that achieves an average macro F1 score of 0.37.
Proposed Approaches in eCAP Segmentation
There exists no prior work on automated eCAP segmentation using ML. As such, we develop and compare 3 different models. Noting the success of image segmentation models using encoder-decoder architectures, we formulate our learning problem similarly where the model trains to convert a given sequence into another sequence of predicted labels for every point.
LSTM-based models have been successfully applied to sequence prediction and other time-series related tasks. As a starting point we take inspiration from existing work in ECG segmentation and begin with BiLSTM-based architectures. Then we consider two encoder-decoder based sequence-to-sequence architectures: LSTM-ED and a 1D convolutional Conv-ED. Including multi–headed attention layers helps compare different fibres in the input sequence simultaneously and in combining the numerical features.
Normalisation and Split
Due to inter-subject variability, we calculate normalisation parameters for every subject instead of the entire training set. Similarly, in the training split, we simulate real-world usage where the model must infer on a completely new subject. We create validation splits such that validation and test splits come from independent subjects.
Results
Tables 1 and 2 give two levels of summarised results; Table 1 shows the weighted averages of the F1 scores and the average macro F1 scores of all fibre types. Table 2 shows the average of F1 scores of four fibre types. We omit the “other” label in the computation of these scores because it is a non-fibre type.
From Table 2, we can see that A-beta and A-gamma are easier to predict relative to other fibres. This can be explained by their consistent activations, in position and shape, in the majority of samples. On the contrary, the lack of consistency in B-fibre activations across subjects, brings the average down considerably.
Overall, BiLSTMs+Attn performs better than the rest and beats the baseline by a slim margin. Conv-ED fails to perform well, whereas LSTM-ED does not give good enough improvement over the baseline.
| Model | Macro F1 Score | Weighted Average F1 |
| Baseline | 0.37 | 0.40 |
| BiLSTM+Attn | 0.485 | 0.498 |
| LSTM-ED | 0.405 | 0.485 |
| Conv-ED | 0.331 | 0.391 |
Table 1: Macro and Weighted Average Macro F1 scores per model
| Model | A-beta | A-gamma | B | A-delta |
| Baseline | 0.58 | 0.53 | 0.36 | 0.03 |
| BiLSTM+Attn | 0.635 | 0.590 | 0.442 | 0.123 |
| LSTM-ED | 0.601 | 0.541 | 0.433 | 0.032 |
| Conv-ED | 0.520 | 0.501 | 0.297 | 0.023 |
Table 2: Average F1 scores per model per fibre type
| Class | Point dist | Sample dist |
| Other | 0.788 | 1.000 |
| B | 0.100 | 0.797 |
| A-gamma | 0.057 | 0.916 |
| A-beta | 0.047 | 0.996 |
| A-delta | 0.007 | 0.130 |
Table 3. A frequency distribution and statistics table highlighting the representation of different fibre types in the data. Point distribution shows the ratio of the number of data points that are labelled as the corresponding fibre type to the rest of the points respectively. Similarly, sample distribution shows the same, but on a sample level with 129,768 being the total number of samples in the dataset.
Challenges and Analysis
We used these results to identify some data and modelling challenges that help us strategize for future data acquisition. In the training datasets we note imperceptible inter-subject variability, lack of varied representation of certain fibre types, and repetition of similar samples within each subject. Increasing model complexity or changing training strategies alone may not help mitigate these challenges.
To further solidify these points, we performed bootstrapping analysis by gradually increasing the number of subjects in the training data. The results correspond with our observations and show us how subject variety helps to an extent. This has given us the necessary incentive to collect more and varied data.
To this end and to integrate the models in a live data collection environment, we have developed an interactive annotation tool to correct the imprecise model predictions. We can then use a feedback loop to improve the model in real-time during the session.
Conclusion
Our study of using ML to automate eCAP segmentation successfully gives a proof of concept to use large data acquisition to facilitate closed-loop vagus nerve stimulation therapies. Compared to manual efforts, our model offers us faster adaptability to unknown subjects and a more reliable, data-driven approach to addressing our task. Moreover, the further analysis performed solidifies our business case to perform more trials and collect better, more targeted data. The annotation tool and the proposed live retraining workflow greatly expedites our efforts towards that end.
References
[1] Berthon, A., Wernisch, L., Stoukidi, M., Thornton, M., Tessier-Lariviere, O., Fortier-Poisson, P., Mamen, J., Pinkney, M., Lee, S., Sarkans, E., Annecchino, L., Appleton, B., Garsed, P., Patterson, B., Gon- shaw, S., Jakopec, M., Shunmugam, S., Edwards, T., Tukiainen, A., Jennings, J., Lajoie, G., Hewage, E., and Armitage, O. Using neural biomarkers to personalize dosing of vagus nerve stimulation. bioRxiv, 2023. doi: 10.1101/2023.08.30.555487. URL https://www.biorxiv.org/content/ early/2023/09/01/2023.08.30.555487.