In the 20th century, advances in biological knowledge and evidence-based medicine were routinely supported by p values and accompanying methods. P-values and null hypothesis testing have long been accepted as the gold standard for clinical decision making and public health policy. Yet, the turn of the century challenges this “one-drug-fits-all” approach. Over recent years, the rise of precision medicine places a premium on customized healthcare and accurate predictions at the level of individual patients. This paradigm shift causes tension between traditional regression methods used to infer statistically significant group differences and burgeoning predictive analysis tools suited to forecast an individual’s health outcome at a later point in time. In a future of single-patient prediction from big biomedical data, it may become central that modeling for inference and modeling for prediction are related but importantly different.
In this article, I discuss our study, ‘Inference and Prediction in Biomedicine’ available on Cell Press and in the upcoming November issue of Patterns. Our comparison employs linear models for identifying significant contributing variables and for finding the most predictive variable sets. By applying systematic data simulations and common medical datasets, we show that diverging conclusions can emerge even when the data are identical and when widespread linear models are used. Awareness of the relative strengths and weaknesses of both “data-analysis cultures” may therefore become crucial for reproducible research, with potential implications for the advancement of personalized medical care.
Change your statistical philosophy and all of a sudden different things become more important.
— Steven Goodman, physician and biostatistician, Stanford University
At the Interface of Machine Learning and Classical Statistics in Biomedicine
Regression-type analysis tools have long been relied upon in biomedical research. However, the same regression analysis tools are often used with non-identical objectives within different scientific communities. On the other hand, the accelerating data deluge in biology and medicine has led to the development of new breeds of modeling approaches, such as flexible prediction algorithms that are well-suited for sieving through rich data to extract subtle patterns in medicine. Due to these recent advances in machine-learning algorithms, applied clinical research has shifted toward combining heterogenous and rich measurements from different sources to “brute-force” forecasting of practically useful endpoints, such as predicting the duration of hospitalization of new patients based on previous electronic health records.
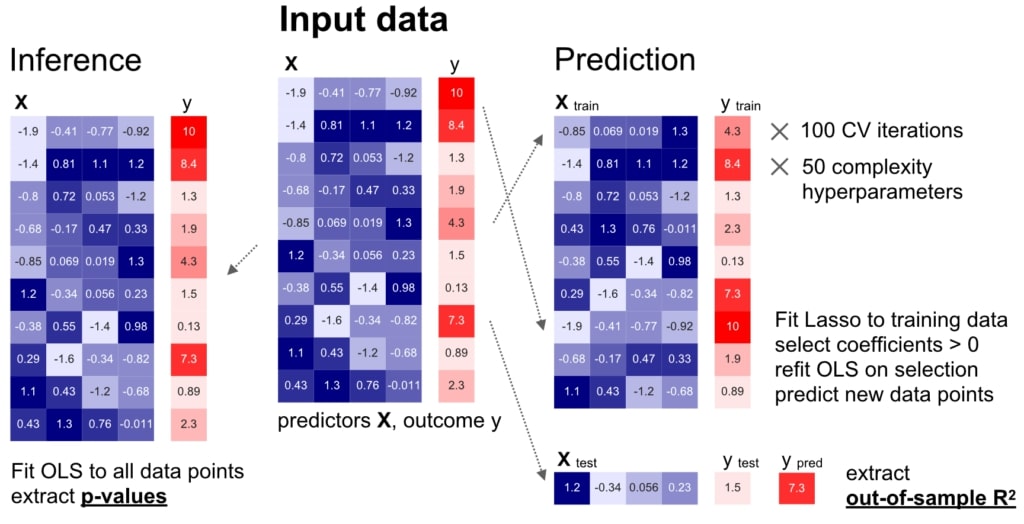
We carried out a careful comparison of modelling for inference (left) and prediction (right) on identical datasets, based on comprehensive empirical simulations and real-world biomedical datasets.
For a long time, these disparate uses of identical analytical tools have been carried out in parallel with little crosstalk between communities. As a result, the empirical relationship between the established agenda of statistical inference and the now expanding agenda of prediction performance from machine learning algorithms remains largely obscure. Therefore, our systematic empirical investigation aims at bringing analytical tools from classical inference and pattern prediction to the same table, highlighting their characteristic commonalities and differences.
Empirical Data Simulation
Our data-simulation approach gave us precise control over five key dataset dimensions, which allowed for careful comparisons between them:
- Available sample size
- Number of informative input variables
- Redundancy of information carried in the input variables about the outcome
- Random noise variation
- Mis-specification of the quantitative model

(A) Based on 113,400 simulations, the discrepancy between predictive and explanatory modeling was quantified in a wide range of possible data-analysis cases. The generated variables and outcomes were analyzed by linear models with the goal to draw classical inference (single best p value among all coefficients, x axis) and to evaluate model forecasting performance on never-seen data (out-of-sample R2 score of the whole model, y axis). We then devised multiple visualizations to grant an overview on complementary facets of this collection of simulation results.
(B) Predictive accuracy and statistical significance are juxtaposed at a refined scale with their relation to the commonly applied thresholds at p < 0.05, p < 0.01, and p < 0.001 (bigger gray circle means bigger sample size).
(C) As smaller p values do not represent stronger statistical evidence, prediction accuracy is compared with the effect size derived from the explained variance on the model-fitting data (in-sample R2 score of the model). In the large majority of conducted data analyses, at least one input variable was significantly related to the response variable at p < 0.05 (red dashed vertical line). However, based on the same data, we observed considerable dispersion in how well such significant linear models were able to make useful predictions on fresh observations. Note that the smallest p values fall within the range below the smallest 64-bit floating point number around 2.2 x 10-308 that can be represented in Python. Such p values are conceptually plausible and can occur in large simulated datasets such as when many predictors explain the outcome and noise is absent.
Across 113,400 simulated datasets, we computed all the possible combinations using a “brute-force” approach and observed several characteristic differences between seeking statistical inference and maximizing prediction from pattern-learning algorithms. In Figure 3, we detail how linear modelling for significance testing and linear modeling for prediction agreed and diverged across constructed datasets. Using the five datasets, we emulated the frequently encountered challenges and scenarios that investigators face on a daily basis, such as increased noise to data and increased correlation shared between the input measures.
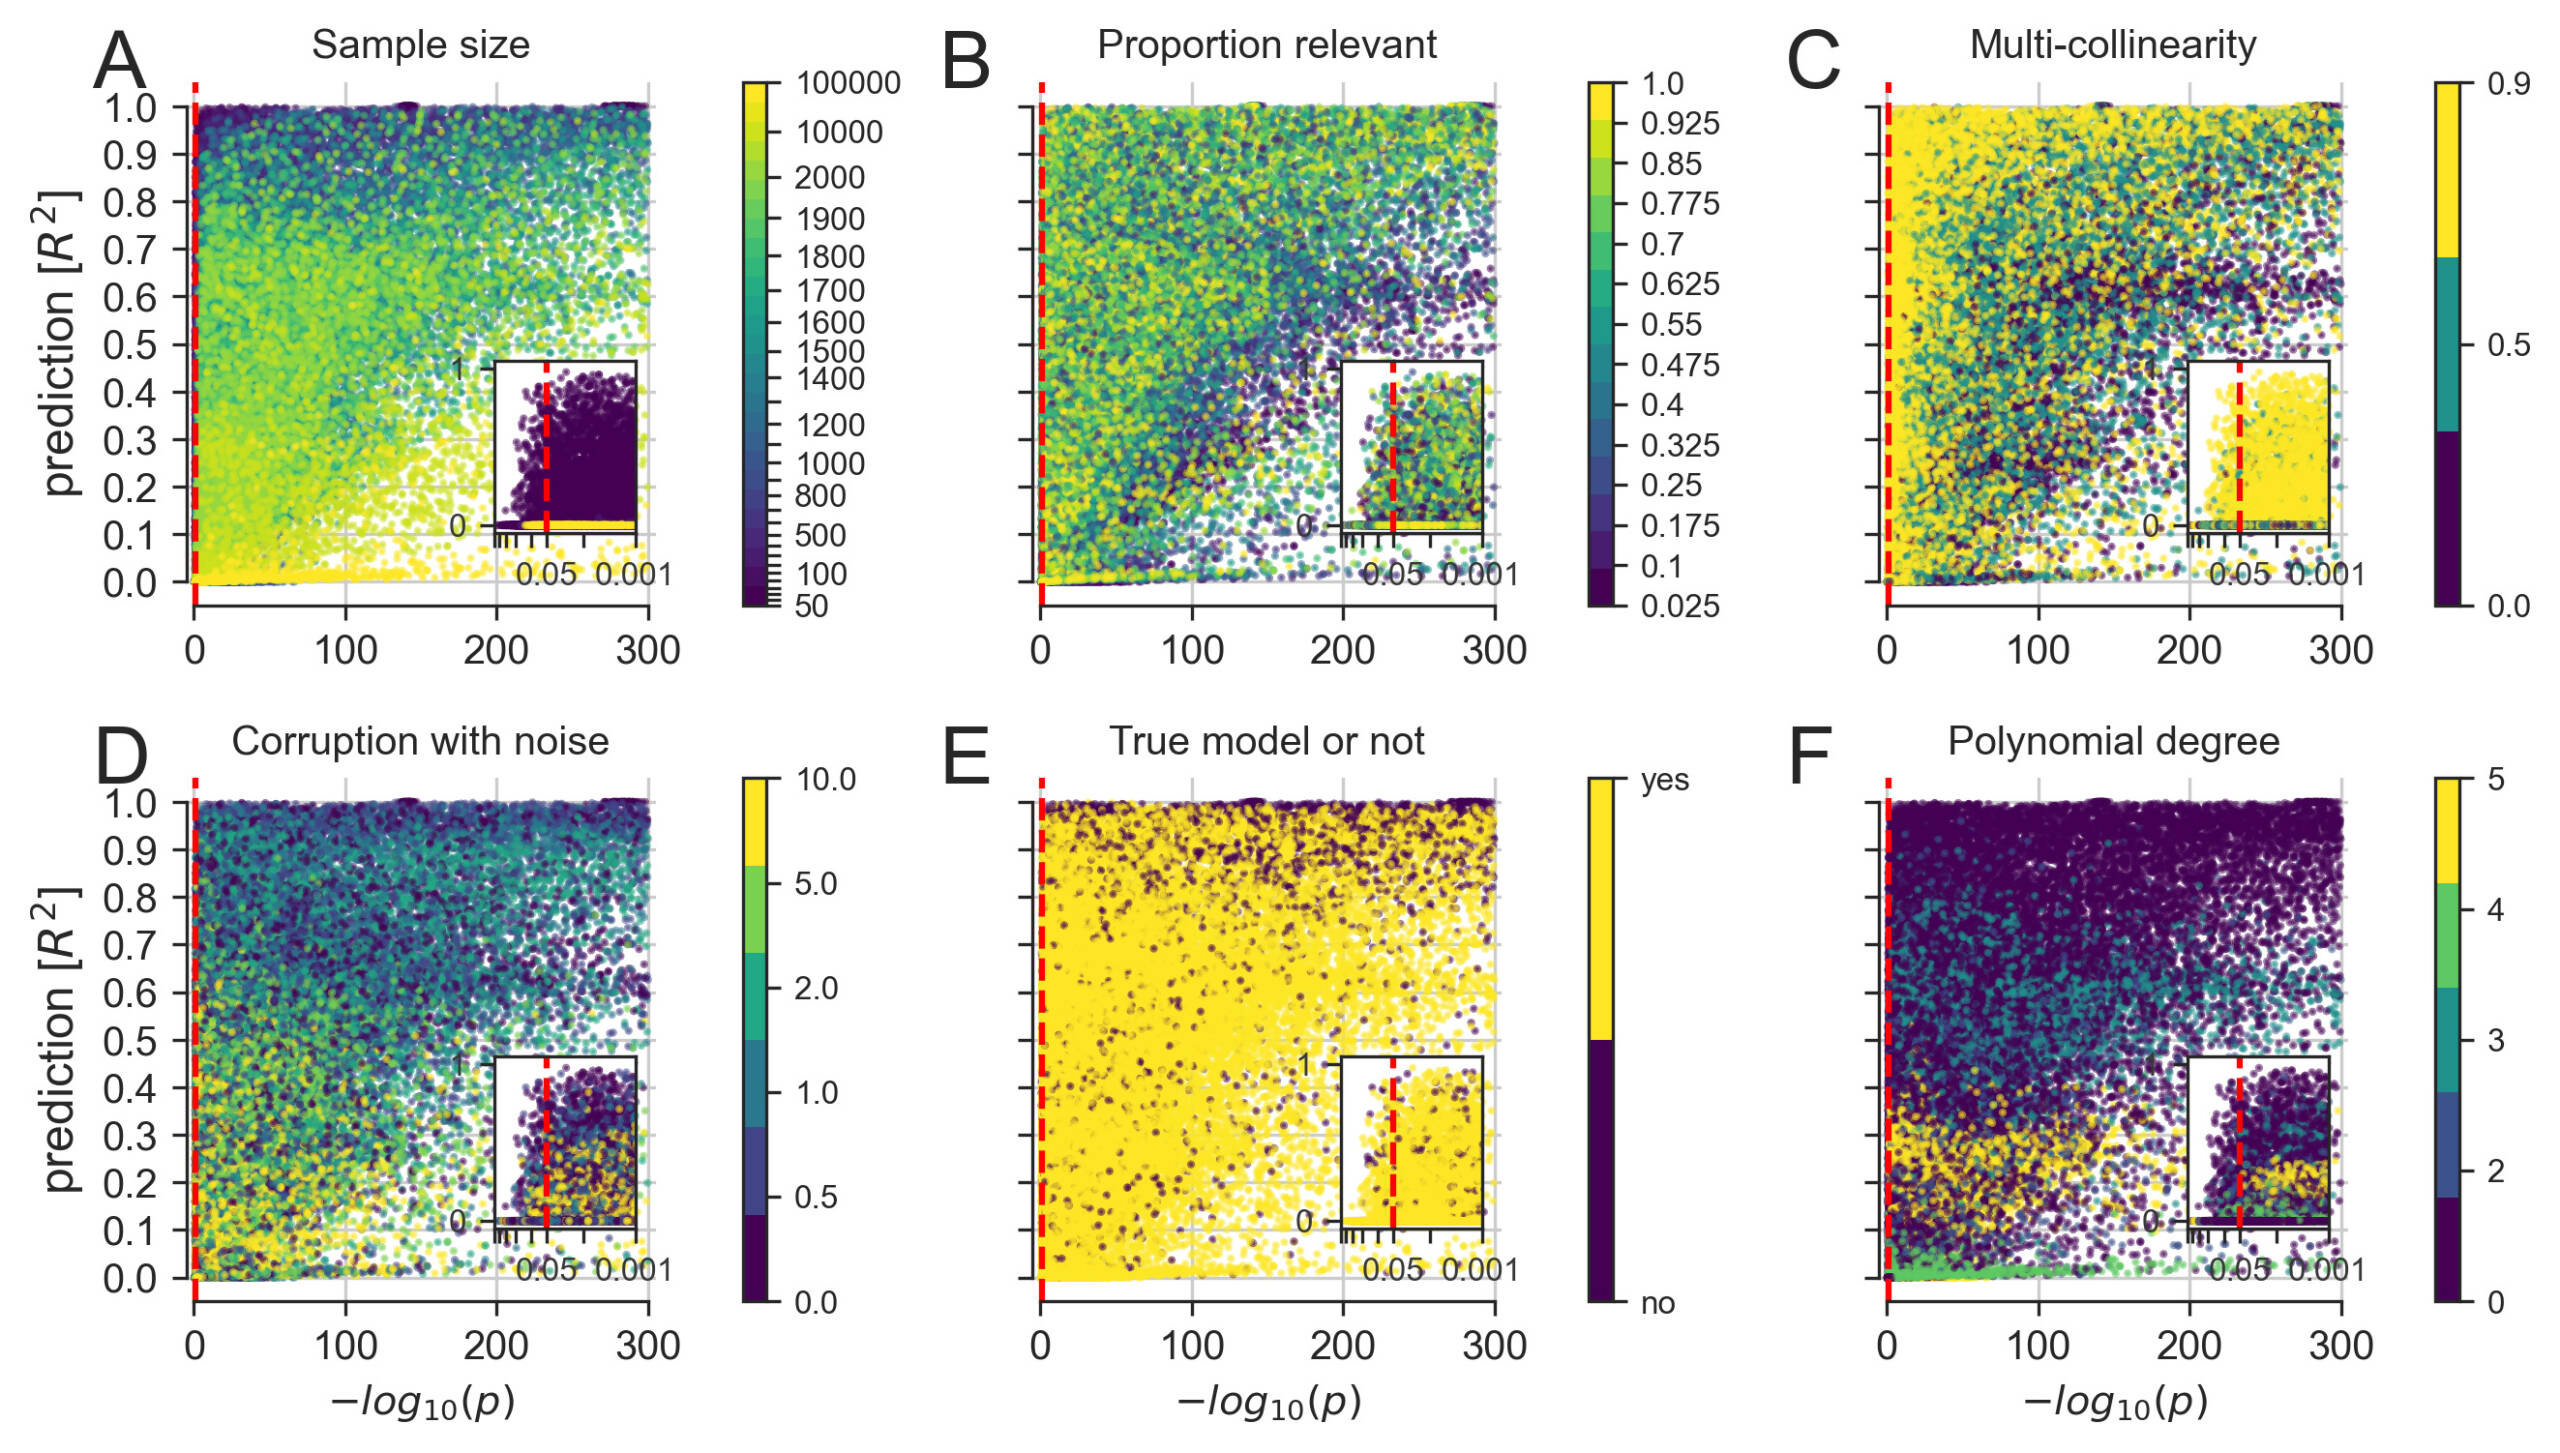
A more detailed exploration of how linear modeling for significance testing (single best p value among all model coefficients, x axis) and linear modeling for prediction (out-of-sample R2 score of the whole model, y axis) agreed and diverged across constructed datasets.
(A) Increasing the number of available data points eventually yielded co-occurrences of strong significance and prediction.
(B) Small numbers of relevant predictors allowed for scenarios with highly significant p values in combination with poor predictive performance.
(C) Increasing correlation between the input measures, common in biological data, appeared to worsen the p values more than the prediction performance.
(D) Increasing random variation in the data, which can be viewed as imitating measurement errors, appeared to decrease the predictability more systematically than the significance.
(E) Pathological settings, where the chosen model does not correspond to the data-generating process of the collection of input and output variables, can enhance both significance and predictions.
(F) Fitting a linear model to data with increasing non-linear effects easily reached significance but distinctly varied in predictability of outcomes.
Our results show a variety of incongruencies in identifying important variables among a set of candidate variables. Using linear models, statistical significance and accurate predictions showed diverging patterns of success at detecting those variables that we knew were relevant for the outcome. For each dataset, the computed recovery based on the subset of ordinary least-squares (OLS) coefficients correctly detected to be significant and active (i.e., non-zero) coefficients of the Lasso model predictively relevant for the outcome. Systematic disagreements between inference and prediction emerged in a number of cases based on available sample size and the number of relevant variables.
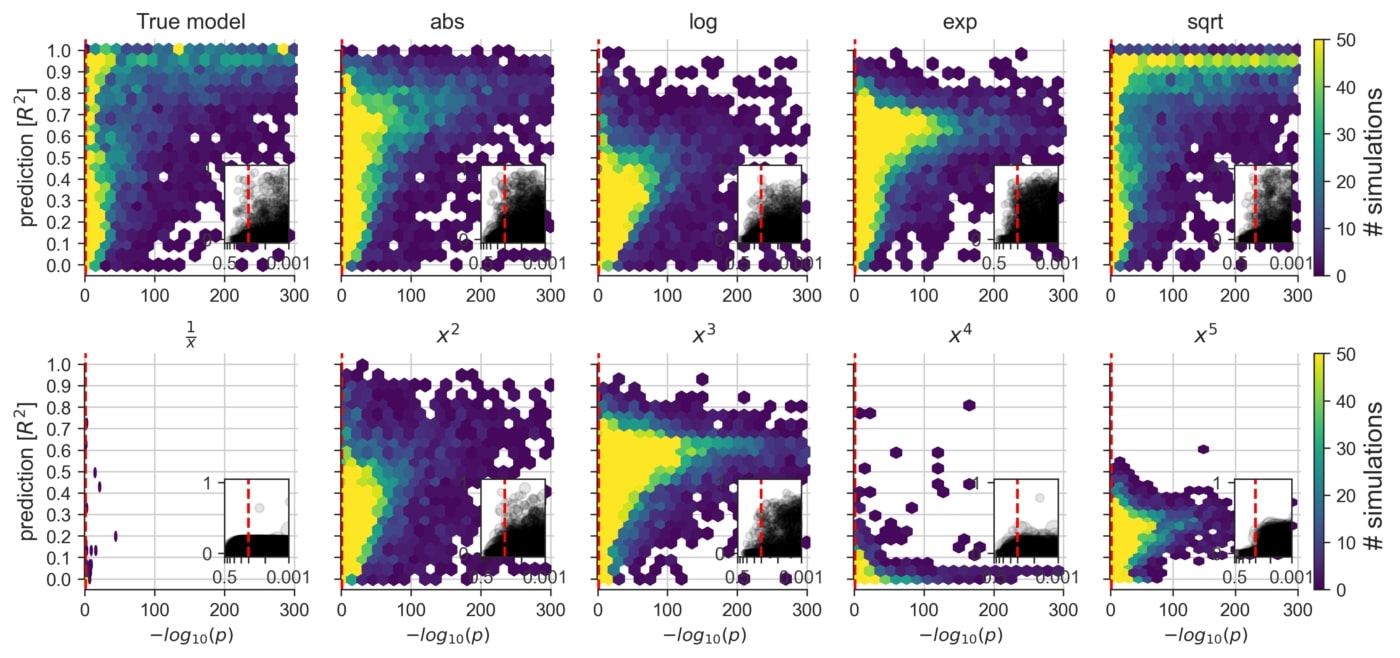
An exploration of the consequences of applying a linear model to datasets that are known to contain non-linear data mechanisms of different types and degrees (cf. Figure 2F). Certain non-linear effects are likely to influence measurements of various real biological systems. That is, in everyday data analysis, some misalignment between the data and the commonly employed linear model is likely to be the rule rather than the exception.
By comparing Lasso and OLS in a variety of synthetic datasets, we observed the largest disagreements in variable identification in datasets with small to moderate sample sizes, which is still a very common situation in day-to-day data analysis in biomedicine. As such, our findings show that more consistent agreement between using linear models for prediction versus inference was observed when the sample size was >1,000 data points and yet, even with ≥10,000 data points, we report certain disagreements.
Real Medical Datasets
To compliment the empirical data simulation portion of this study, we carried out the same direct comparison between the explanatory modeling and predictive modeling in common real-world datasets as shown in Figure 9. The quantitative re-evaluation is presented for four real-world medical datasets popular in data-analysis teaching: birthweight, prostate cancer, diabetes and forced expiratory volume. A complete overview of the biomedical datasets results can be found on Cell Press and in the upcoming November issue of Patterns.

Integrative plots depict the inferential importance of each linear model coefficient (p values on x axis, log-transformed) and the predictive importance of coefficient sets (out-of-sample R2 scores on y axis, obtained from model application on data not used for model fitting).
(A) The body weight is to be derived from eight measures in 189 newborns. Three out of eight measures are statistically significantly associated with birth weight at p < 0.05 (red line). However, using the linear model for prediction explained only 8% of the variance in new babies (R2 = 0.08).
(B) Prostate-specific antigen (PSA), a molecule for prostate carcinoma screening, is to be derived from eight measures in 87 men. None of the eight coefficients reached statistical significance based on common linear regression, although the fitted coefficients of the predictive model achieved 42% explained variance in unseen men.
(C) Disease progression after 1 year is to be derived from 10 measures in 442 diabetes patients. Body mass index (bmi) gave the only significant coefficient (p = 0.01), which alone, however, explained only an estimated 3% of disease progression in future patients. The full coefficients of the predictive model achieve 46% explained variance in independent patients.
(D) Lung capacity as quantified by forced expiratory volume (FEV) is to be derived from four measures in 654 healthy individuals. All measures easily exceeded the statistical significance threshold. However, a predictive model incorporating body height alone performed virtually on par with predictions based on all four coefficients (R2 = 0.74 versus R2 = 0.76).
To expose the trade-off between parsimony and prediction performance, the circles (green) show the sets of Lasso coefficients at different sparsity levels. In sum, linear models can show all combinations of predictive versus not and significant versus not in biomedical data analysis.
Practical Implications
Our quantitative investigation reveals how widely-used quantitative models can be employed with distinct and partly incompatible motivations. While implementing these analytical tools for the purpose of inference is useful for uncovering characteristics in biological processes, and using linear modeling for prediction is well-suited for pragmatic forecasting of biological processes, it now becomes critical for healthcare professionals and researchers to acknowledge the partly incongruent modeling philosophies of drawing statistical inference and seeking algorithmic prediction.
As we approach future advances in precision medicine, it becomes essential that modeling for inference and modeling for prediction are related but importantly different. We have demonstrated through our empirical simulation and real-world biomedical datasets that diverging conclusions can emerge, even when the data are the same and widespread linear models are used. With the exponentially growing availability of medical big data that is actionable for machine learning, and because there is a deviation, understanding how these machine learning predictions are situated within the broader landscape is now of paramount importance, as this concerns all medical disciplines and the future of clinical decision making and public health policy decisions.
Read More
This blog post is based on our recent paper:
Inference and Prediction Diverge in Biomedicine
Danilo Bzdok, Denis Engemann, and Bertrand Thirion
Open access article: https://www.cell.com/patterns/fulltext/S2666-3899(20)30160-4
- To explore the >100,000 simulation results in real time on the relationship between inference and prediction, check out our WebApp (binder-enabled) here.
- All analysis scripts and necessary data that reproduce the results of the present study are readily accessible and open for reuse on Github here.
References
[1] Yau, T. O. (2019). Precision Treatment in Colorectal Cancer: Now and the Future. Journal of Gastroenterology and hepatology, 3, 361-369. https://onlinelibrary.wiley.com/doi/epdf/10.1002/jgh3.12153
[2] Effron, B. & Hastie, T. (2016). Computer Age Statistical Inference. Cambridge University Press).


