Events
Mila Techaide 2026
Join us for a new edition of this one-day research conference on AI in support of Centraide of Greater Montreal.
Industry
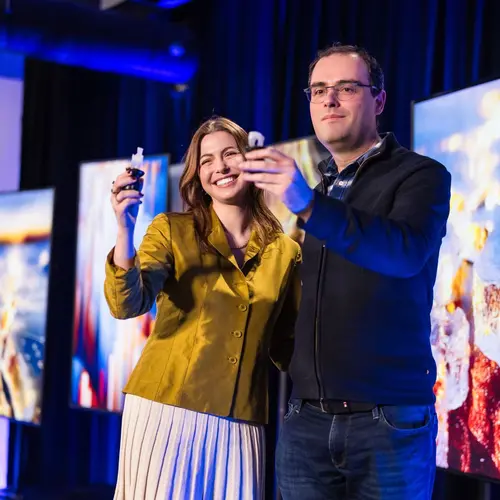
Venture Scientist Bootcamp
Join us on the Venture Scientist Bootcamp, a full time, 4-month incubator at Mila, built specifically for deep tech founders with elite STEM backgrounds.
Learning

AI Advantage: Productivity in Public Service
Learn how to leverage generative AI to support and improve your productivity at work. The next cohort will take place online on April 28 and 30, 2026, in French.